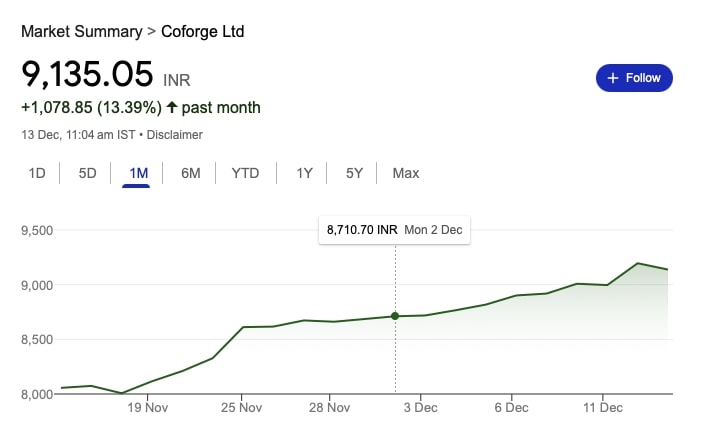
Current Fundamentals of Coforge Ltd :-
| Company Essentials | Value | Company Essentials | Value |
|---|---|---|---|
| Market Cap | ₹ 61,434.41 Cr. | EPS (TTM) | ₹ 119.22 |
| Enterprise Value | ₹ 61,193.91 Cr. | Sales Growth | 14.53% |
| No. of Shares | 6.69 Cr. | ROE | 25.40% |
| P/E | 77.07 | ROCE | 31.28% |
| P/B | 10.28 | Profit Growth | 12.15% |
| Face Value | ₹ 10 | Div. Yield | 0.83% |
| Book Value (TTM) | ₹ 894.21 | CASH | ₹ 578.70 Cr. |
| DEBT | ₹ 338.20 Cr. | Promoter Holding | 0 % |
Shareholding Pattern in Coforge Ltd :-
| Category | Sep 2024 | Jun 2024 | Mar 2024 | Dec 2023 | Sep 2023 | Jun 2023 |
|---|---|---|---|---|---|---|
| Promoter (%) | 0.0% | 0.0% | 0.0% | 0.0% | 0.0% | 26.6% |
| FII (%) | 42.1% | 41.4% | 35.0% | 34.0% | 34.4% | 24.8% |
| DII (%) | 48.2% | 47.3% | 54.3% | 55.0% | 54.3% | 37.2% |
| Public (%) | 9.8% | 11.3% | 10.7% | 11.0% | 11.4% | 11.4% |
| Others (%) | 0.0% | 0.0% | 0.0% | 0.0% | 0.0% | 0.0% |
Target in Coforge Ltd :-
Future Plan of Coforge Ltd :-
Coforge has shared plans to increase its profit margin by 100-300 basis points in the medium term. Analysts have mixed opinions about this strategy.
Positive Views:
- Nomura: Recommends buying the stock with a target price of ₹4,920, suggesting an 8% gain from Monday’s closing price. They view the management’s comments as encouraging and note that the stock is valued at 21 times its expected earnings for FY2025.
- Nuvama: Also advises buying the stock with a higher target price of ₹5,500, implying a 20% potential gain. This is the third-highest target, following Macquarie (₹5,840) and B&K Securities (₹5,520).
Cautious View:
- Citi: Predicts that margins will stay similar to FY2023 levels, with only a slight improvement in gross margin (50 basis points) in FY2024. Citi has given a “sell” rating with a target price of ₹3,980, indicating a possible 14% drop from current levels. Citi is one of six analysts who recommend selling the stock.
Quarterly Reports :-
| Particulars | Mar 2024 | Jun 2024 | Sep 2024 |
|---|---|---|---|
| Net Sales (₹ Cr.) | 2,358.50 | 2,400.80 | 3,062.30 |
| Total Expenditure (₹ Cr.) | 1,972.80 | 2,107.50 | 2,650.40 |
| Operating Profit (₹ Cr.) | 385.70 | 293.30 | 411.90 |
| Other Income (₹ Cr.) | 9.90 | 25.40 | 56.30 |
| Interest (₹ Cr.) | 37.00 | 32.50 | 30.40 |
| Depreciation (₹ Cr.) | 84.60 | 81.50 | 124.30 |
| Exceptional Items (₹ Cr.) | 11.60 | 0.00 | 0.00 |
| Profit Before Tax (₹ Cr.) | 285.60 | 204.70 | 313.50 |
| Tax (₹ Cr.) | 56.40 | 65.40 | 79.90 |
| Profit After Tax (₹ Cr.) | 229.20 | 139.30 | 233.60 |
| Adjustments (₹ Cr.) | -5.50 | -6.10 | -31.40 |
| Consolidated Net Profit (₹ Cr.) | 223.70 | 133.20 | 202.20 |
| Adjusted EPS (₹) | 36.20 | 19.97 | 30.31 |
Profit & Loss :-
| Particulars | Mar 2022 | Mar 2023 | Mar 2024 |
|---|---|---|---|
| Net Sales (₹ Cr.) | 6,432.00 | 8,014.60 | 9,179.00 |
| Total Expenditure (₹ Cr.) | 5,330.10 | 6,733.90 | 7,751.40 |
| Operating Profit (₹ Cr.) | 1,101.90 | 1,280.70 | 1,427.60 |
| Other Income (₹ Cr.) | 51.80 | 61.90 | 61.40 |
| Interest (₹ Cr.) | 65.00 | 80.60 | 125.60 |
| Depreciation (₹ Cr.) | 227.20 | 258.50 | 318.50 |
| Exceptional Items (₹ Cr.) | 0.00 | -52.30 | 0.00 |
| Profit Before Tax (₹ Cr.) | 861.50 | 951.20 | 1,044.90 |
| Tax (₹ Cr.) | 146.80 | 206.10 | 209.30 |
| Profit After Tax (₹ Cr.) | 714.70 | 745.10 | 835.60 |
| Adjustments (₹ Cr.) | -53.00 | -51.30 | -27.60 |
| Consolidated Net Profit (₹ Cr.) | 661.70 | 693.80 | 808.00 |
| Adjusted EPS (₹) | 108.65 | 113.55 | 130.74 |
Balance Sheet :-
| Particulars | Mar 2022 | Mar 2023 | Mar 2024 |
|---|---|---|---|
| Equity and Liabilities | |||
| Share Capital (₹ Cr.) | 60.90 | 61.10 | 61.80 |
| Total Reserves (₹ Cr.) | 2,672.20 | 3,021.40 | 3,564.80 |
| Minority Interest (₹ Cr.) | 98.30 | 87.40 | 100.30 |
| Borrowings (₹ Cr.) | 336.50 | 338.20 | 339.90 |
| Other N/C Liabilities (₹ Cr.) | 1,542.70 | 1,471.50 | 1,698.50 |
| Current Liabilities (₹ Cr.) | 1,179.20 | 1,739.30 | 1,531.50 |
| Total Liabilities (₹ Cr.) | 5,889.80 | 6,718.90 | 7,296.80 |
| Assets | |||
| Net Block (₹ Cr.) | 2,066.70 | 2,311.90 | 2,353.00 |
| Capital WIP (₹ Cr.) | 8.60 | 4.60 | 23.20 |
| Intangible WIP (₹ Cr.) | 8.20 | 0.00 | 0.00 |
| Investments (₹ Cr.) | 0.00 | 0.00 | 0.00 |
| Loans & Advances (₹ Cr.) | 1,543.60 | 1,777.80 | 2,293.40 |
| Other N/C Assets (₹ Cr.) | 41.80 | 18.20 | 24.70 |
| Current Assets (₹ Cr.) | 2,220.90 | 2,606.40 | 2,602.50 |
| Total Assets (₹ Cr.) | 5,889.80 | 6,718.90 | 7,296.80 |
Cash Flow :-
| Particulars | Mar 2022 | Mar 2023 | Mar 2024 |
|---|---|---|---|
| Profit from Operations (₹ Cr.) | 861.50 | 951.20 | 1,044.90 |
| Adjustment (₹ Cr.) | 312.00 | 382.00 | 504.60 |
| Changes in Assets & Liabilities (₹ Cr.) | -143.30 | -102.70 | -280.00 |
| Tax Paid (₹ Cr.) | -264.60 | -280.00 | -366.10 |
| Operating Cash Flow (₹ Cr.) | 765.60 | 950.50 | 903.40 |
| Investing Cash Flow (₹ Cr.) | -962.90 | -269.20 | -265.00 |
| Financing Cash Flow (₹ Cr.) | -155.80 | -558.20 | -887.00 |
| Net Cash Flow (₹ Cr.) | -353.10 | 123.10 | -248.60 |

